Current Works

Sonification Process
The image on the left shows the painting that was used as the basis for this first investigation into the sonification of painting. The center image shows the five areas of the same painting that were scanned using Fourier-domain optical coherence tomography. The image on the right shows the visual mapping of the scientific data (of the masked square – labeled number 1- in the middle image) which is laid over the actual area of the painting from which the data was derived.
Video credit: Florian Grond, © Florian Grond, 2014. Used with permission.
This animation shows the trajectory of the path through one section of the painting in Delay.
To take advantage of the auditory sense’s capacities and to bring about a deeper understanding of visual works, one-inch sections of the painting in Delay were scanned1 using a rich imaging technique. Then, opposed to proceeding line-by-line through the rows of numbers and ascribing a sound to each number generated by the scan, the acoustic artist Florian Grond extracted surface profiles from the data, following predetermined paths that are reminiscent of both drawing and the way the eye scans a painting.
1 Provided by the scientist Brett Bouma’s assistant Martin Villiger at the Wellman Center for Photomedicine (Massachusetts General Hospital Harvard Medical School) using Fourier- domain optical coherence tomography, a rich imaging technique.
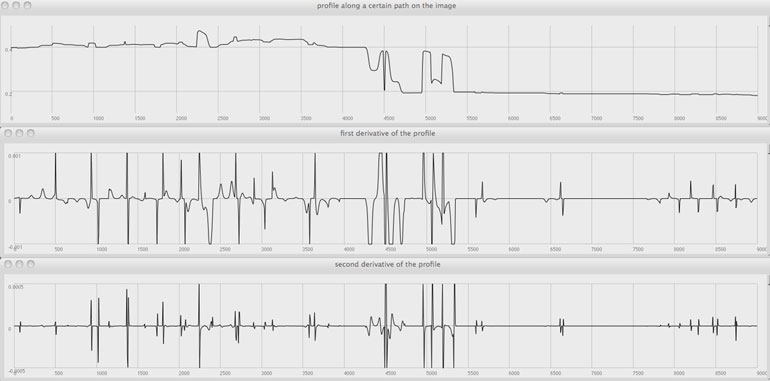
The first graph (above) shows the contour of the painting’s surface – its hills and valleys. The second graph is derived from the first and shows the rate of change on the painting’s surface – regardless of whether the change is in a so-called hill or valley. The third graph represents how sharp the edges of this change are on the painting’s surface and provides the signal from which the audification is made. Thus, for each point that corresponds to a structural event on the painting (caused by the way it was painted, scored and relieved and, also, indicated in the data), a click with a distinct sonic timbre was created.
Grond then took the clicks derived from the painting and manipulated them further. To give a sense of whether the click “resides” in the hills or valleys of the paint surface, reverb was added: the reverberant clicks would now be rather dry in the areas closer to the viewer (the hills) or wet and resonant when further away (in the valleys). Next, to connect these sounds of the surface structure to the colors in the painting (mostly white), the painting’s RGB/color frequencies were mapped to spectral envelopes that would be close to human vowel-like sounds. This made the initial clicks a bit less harsh and less immediately bound to an identifiable sonic source.
Finally, to make the sounds even less source-binding, they were stretched out a bit more (through granular re-synthesis), which made them even more curious and suited to so many aspects of Delay, the title and content of the piece inspired by this research. The sounds then are not directly identifiable as something concrete. For instance, this is the [sound] of one portion of the painting. Nonetheless, in their creation, they allude to the idea of the painting’s “voice.” Or to directly quote Grond, “The irregular occurrence of surface incidents now became repeated articulations of various forms and lengths – all of them at the brink of speaking out, without saying something, but asking for further exploration of the perceived.”
Parts of this text first appeared in Mary Sherman: What if You Could Hear a Painting, Leonardo Electronic Almanac/MIT Press, Vol 22., No 2, 2016.